


Visualize Your Data on the Map
See territory value and coverage visually so you can spot gaps and make faster planning decisions.
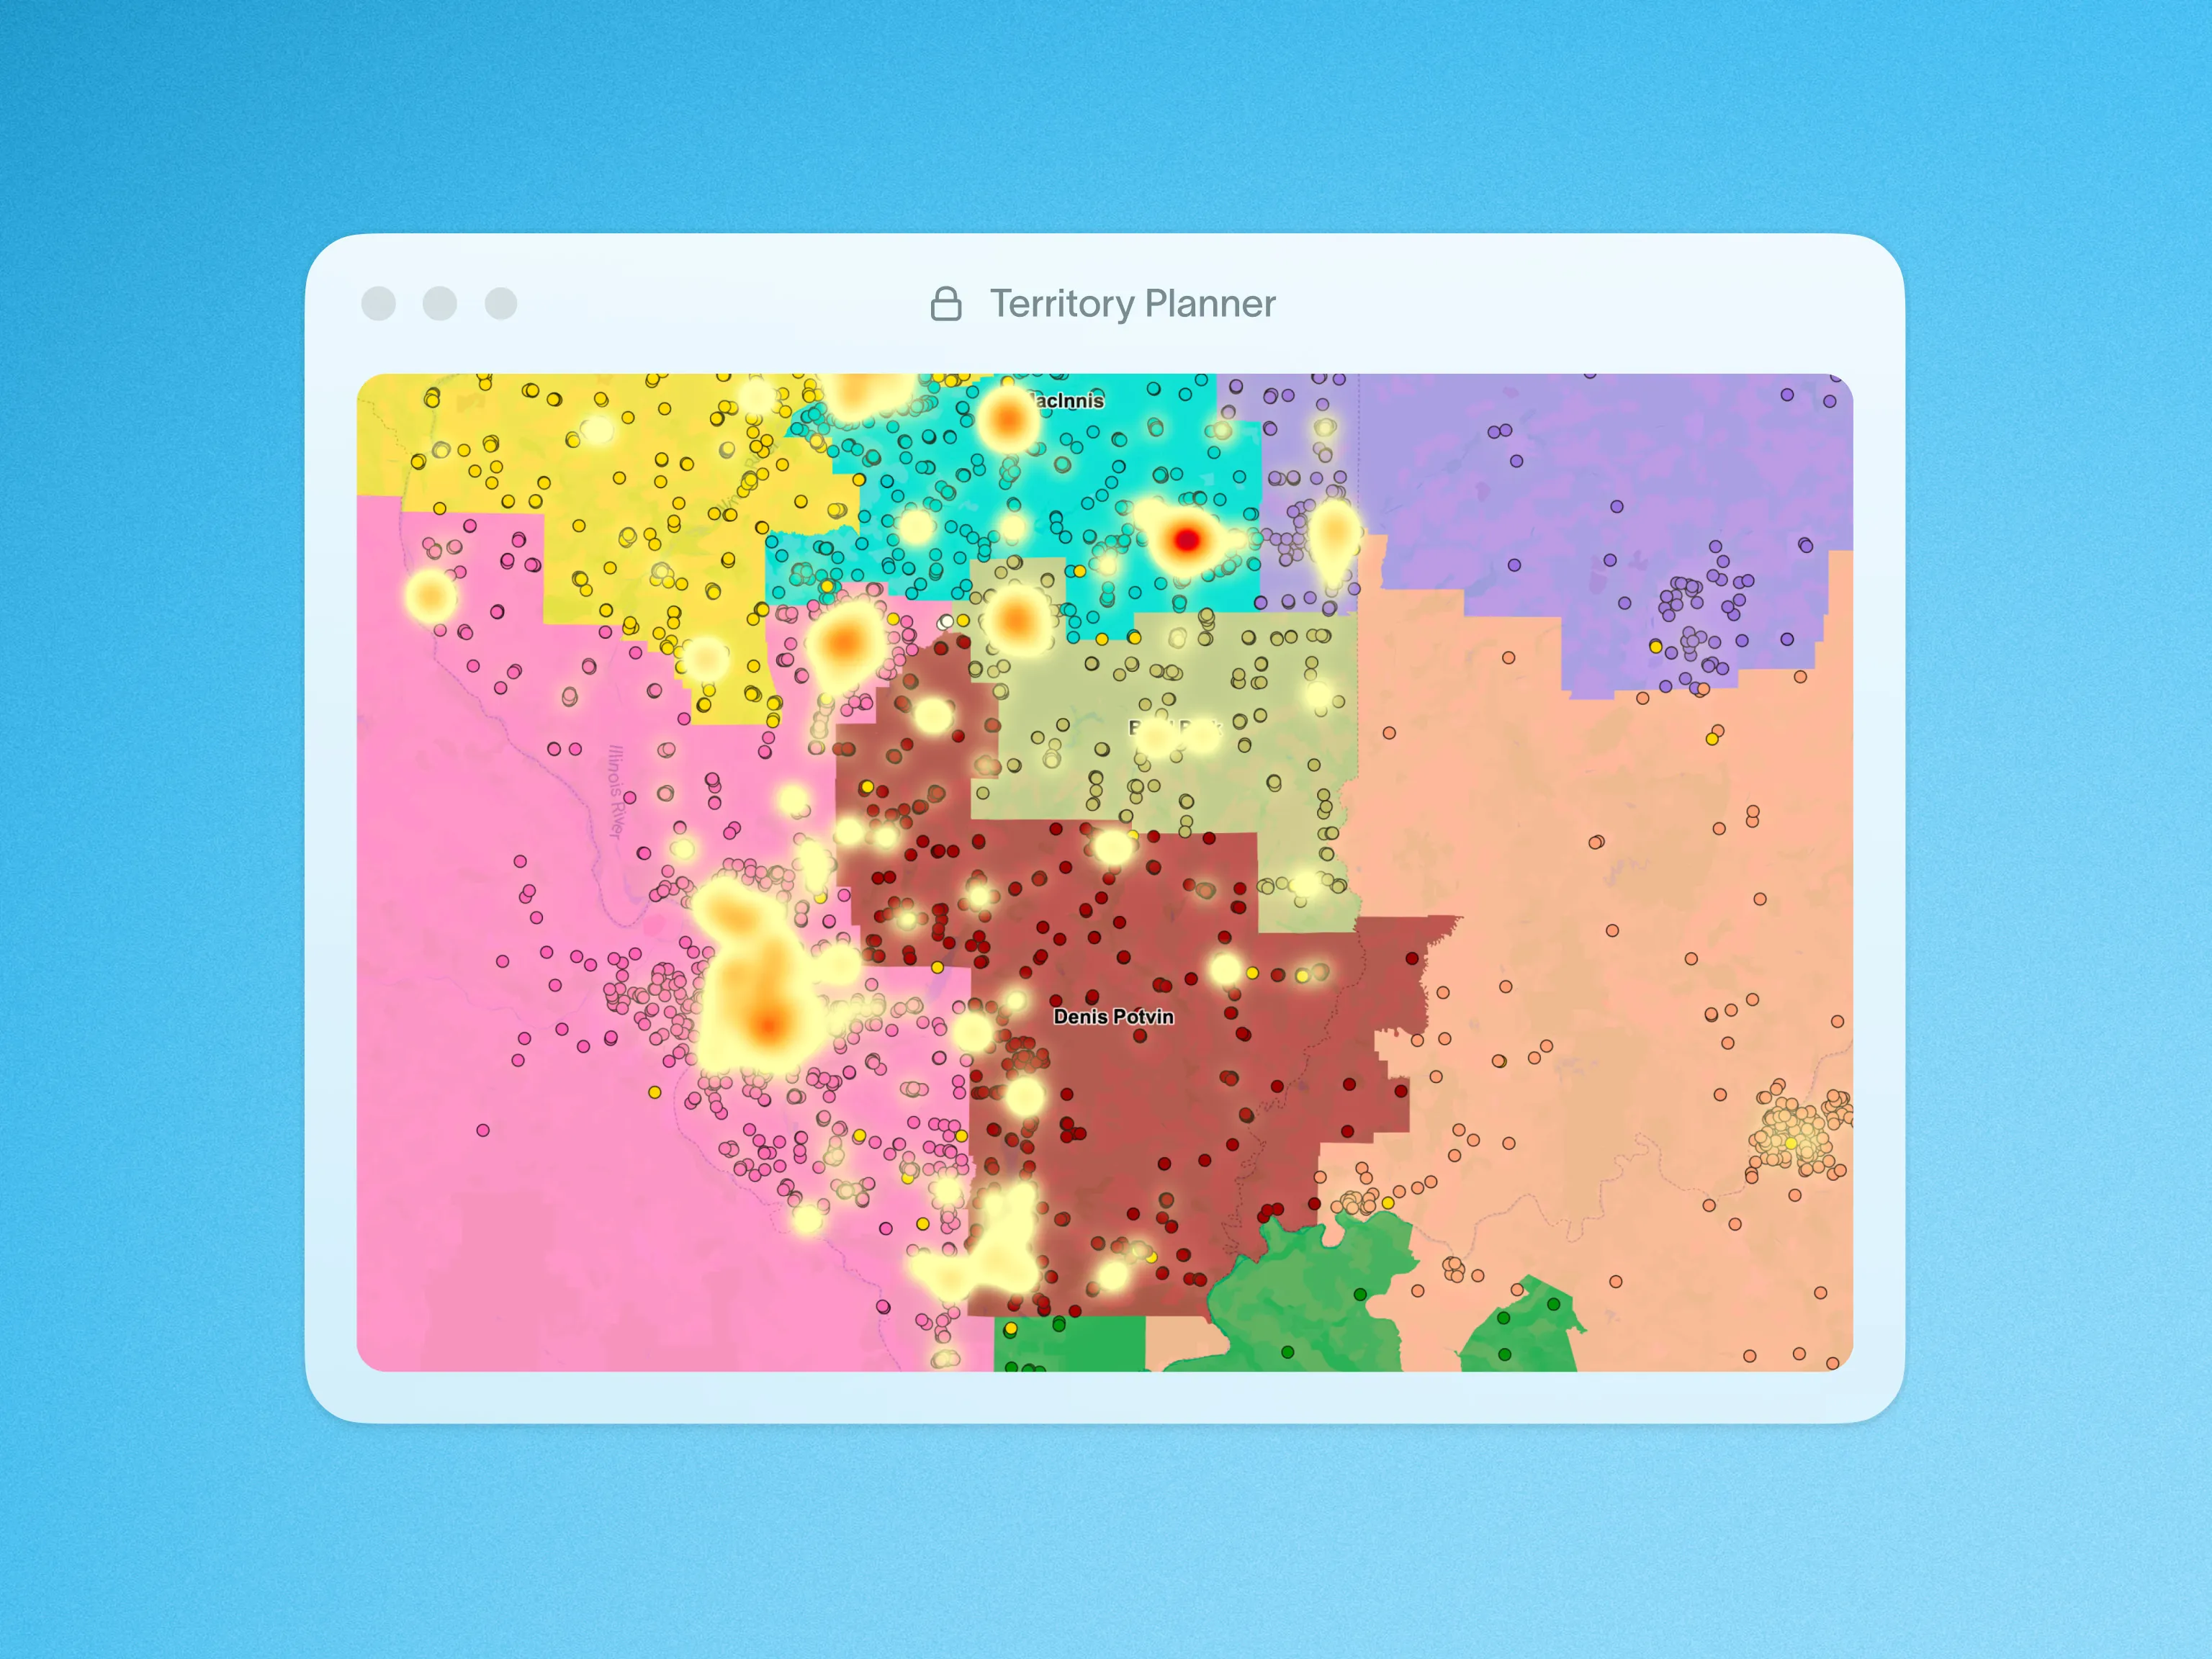
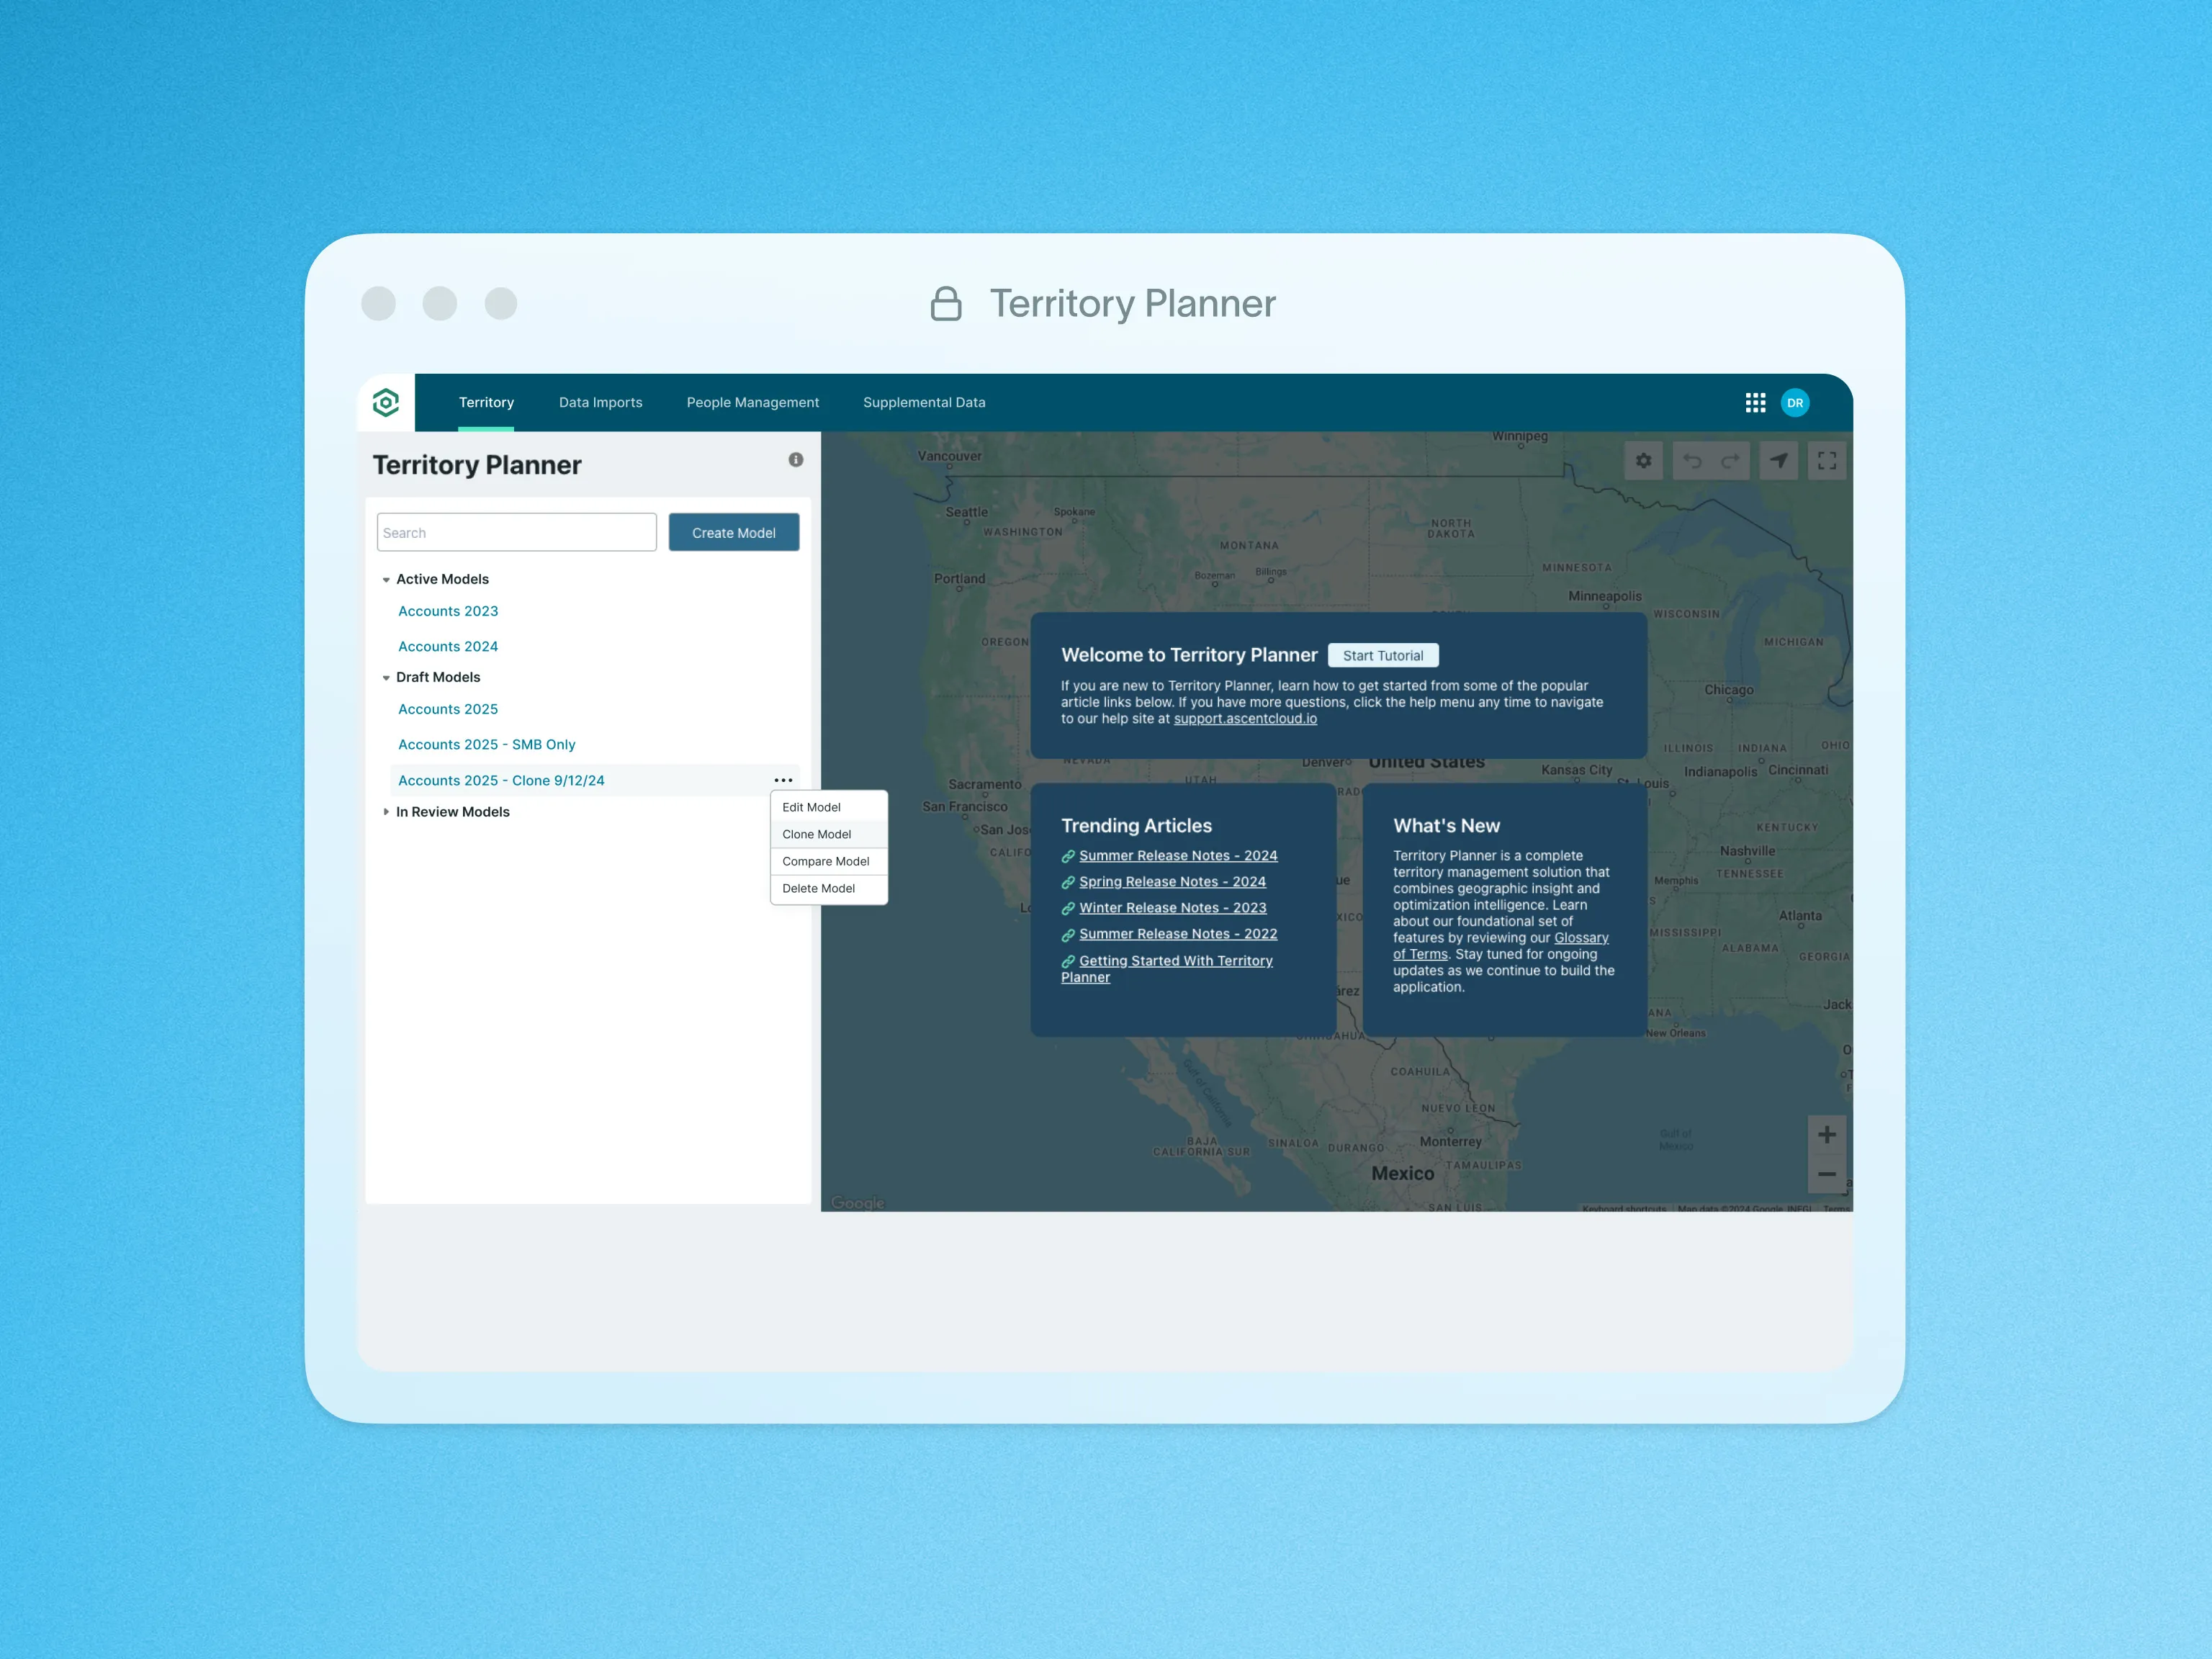
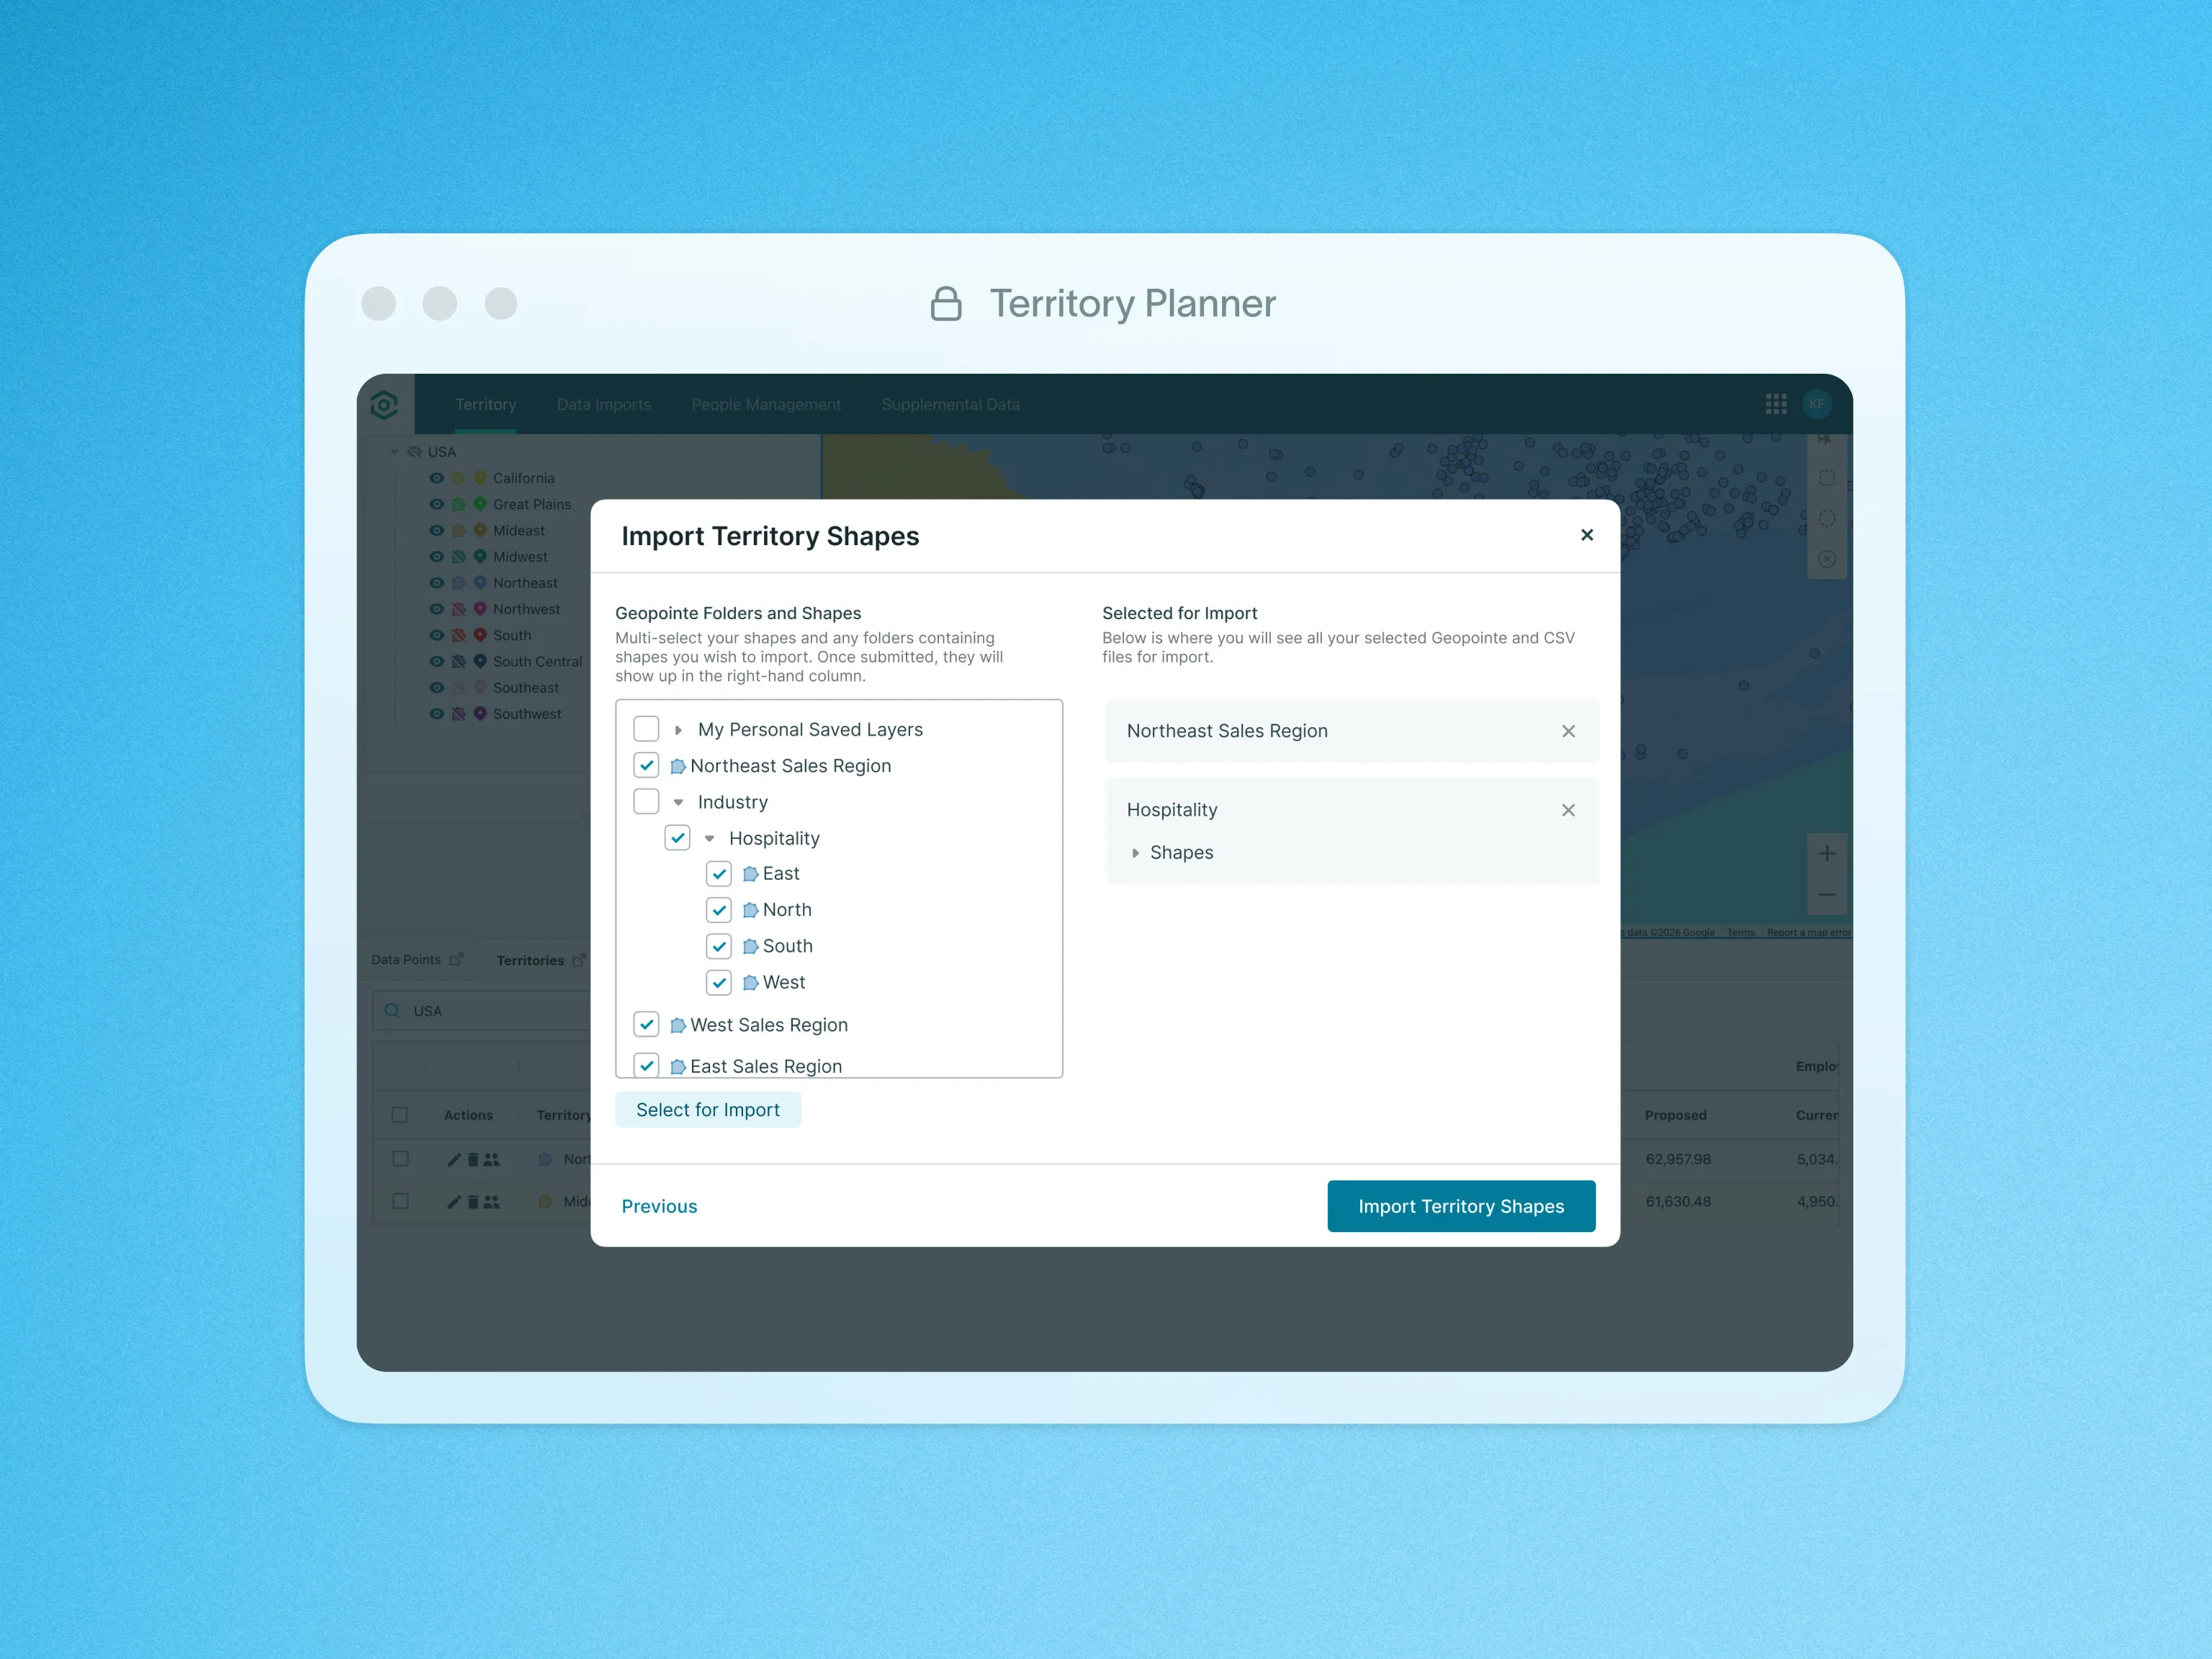
Bring your data to life on the map. Your records will appear in concentration clusters, which allows you to see patterns as you build out territories. You can also visualize territories with color-coded data points and shapes, making it easy to understand distributions and allocations quickly.
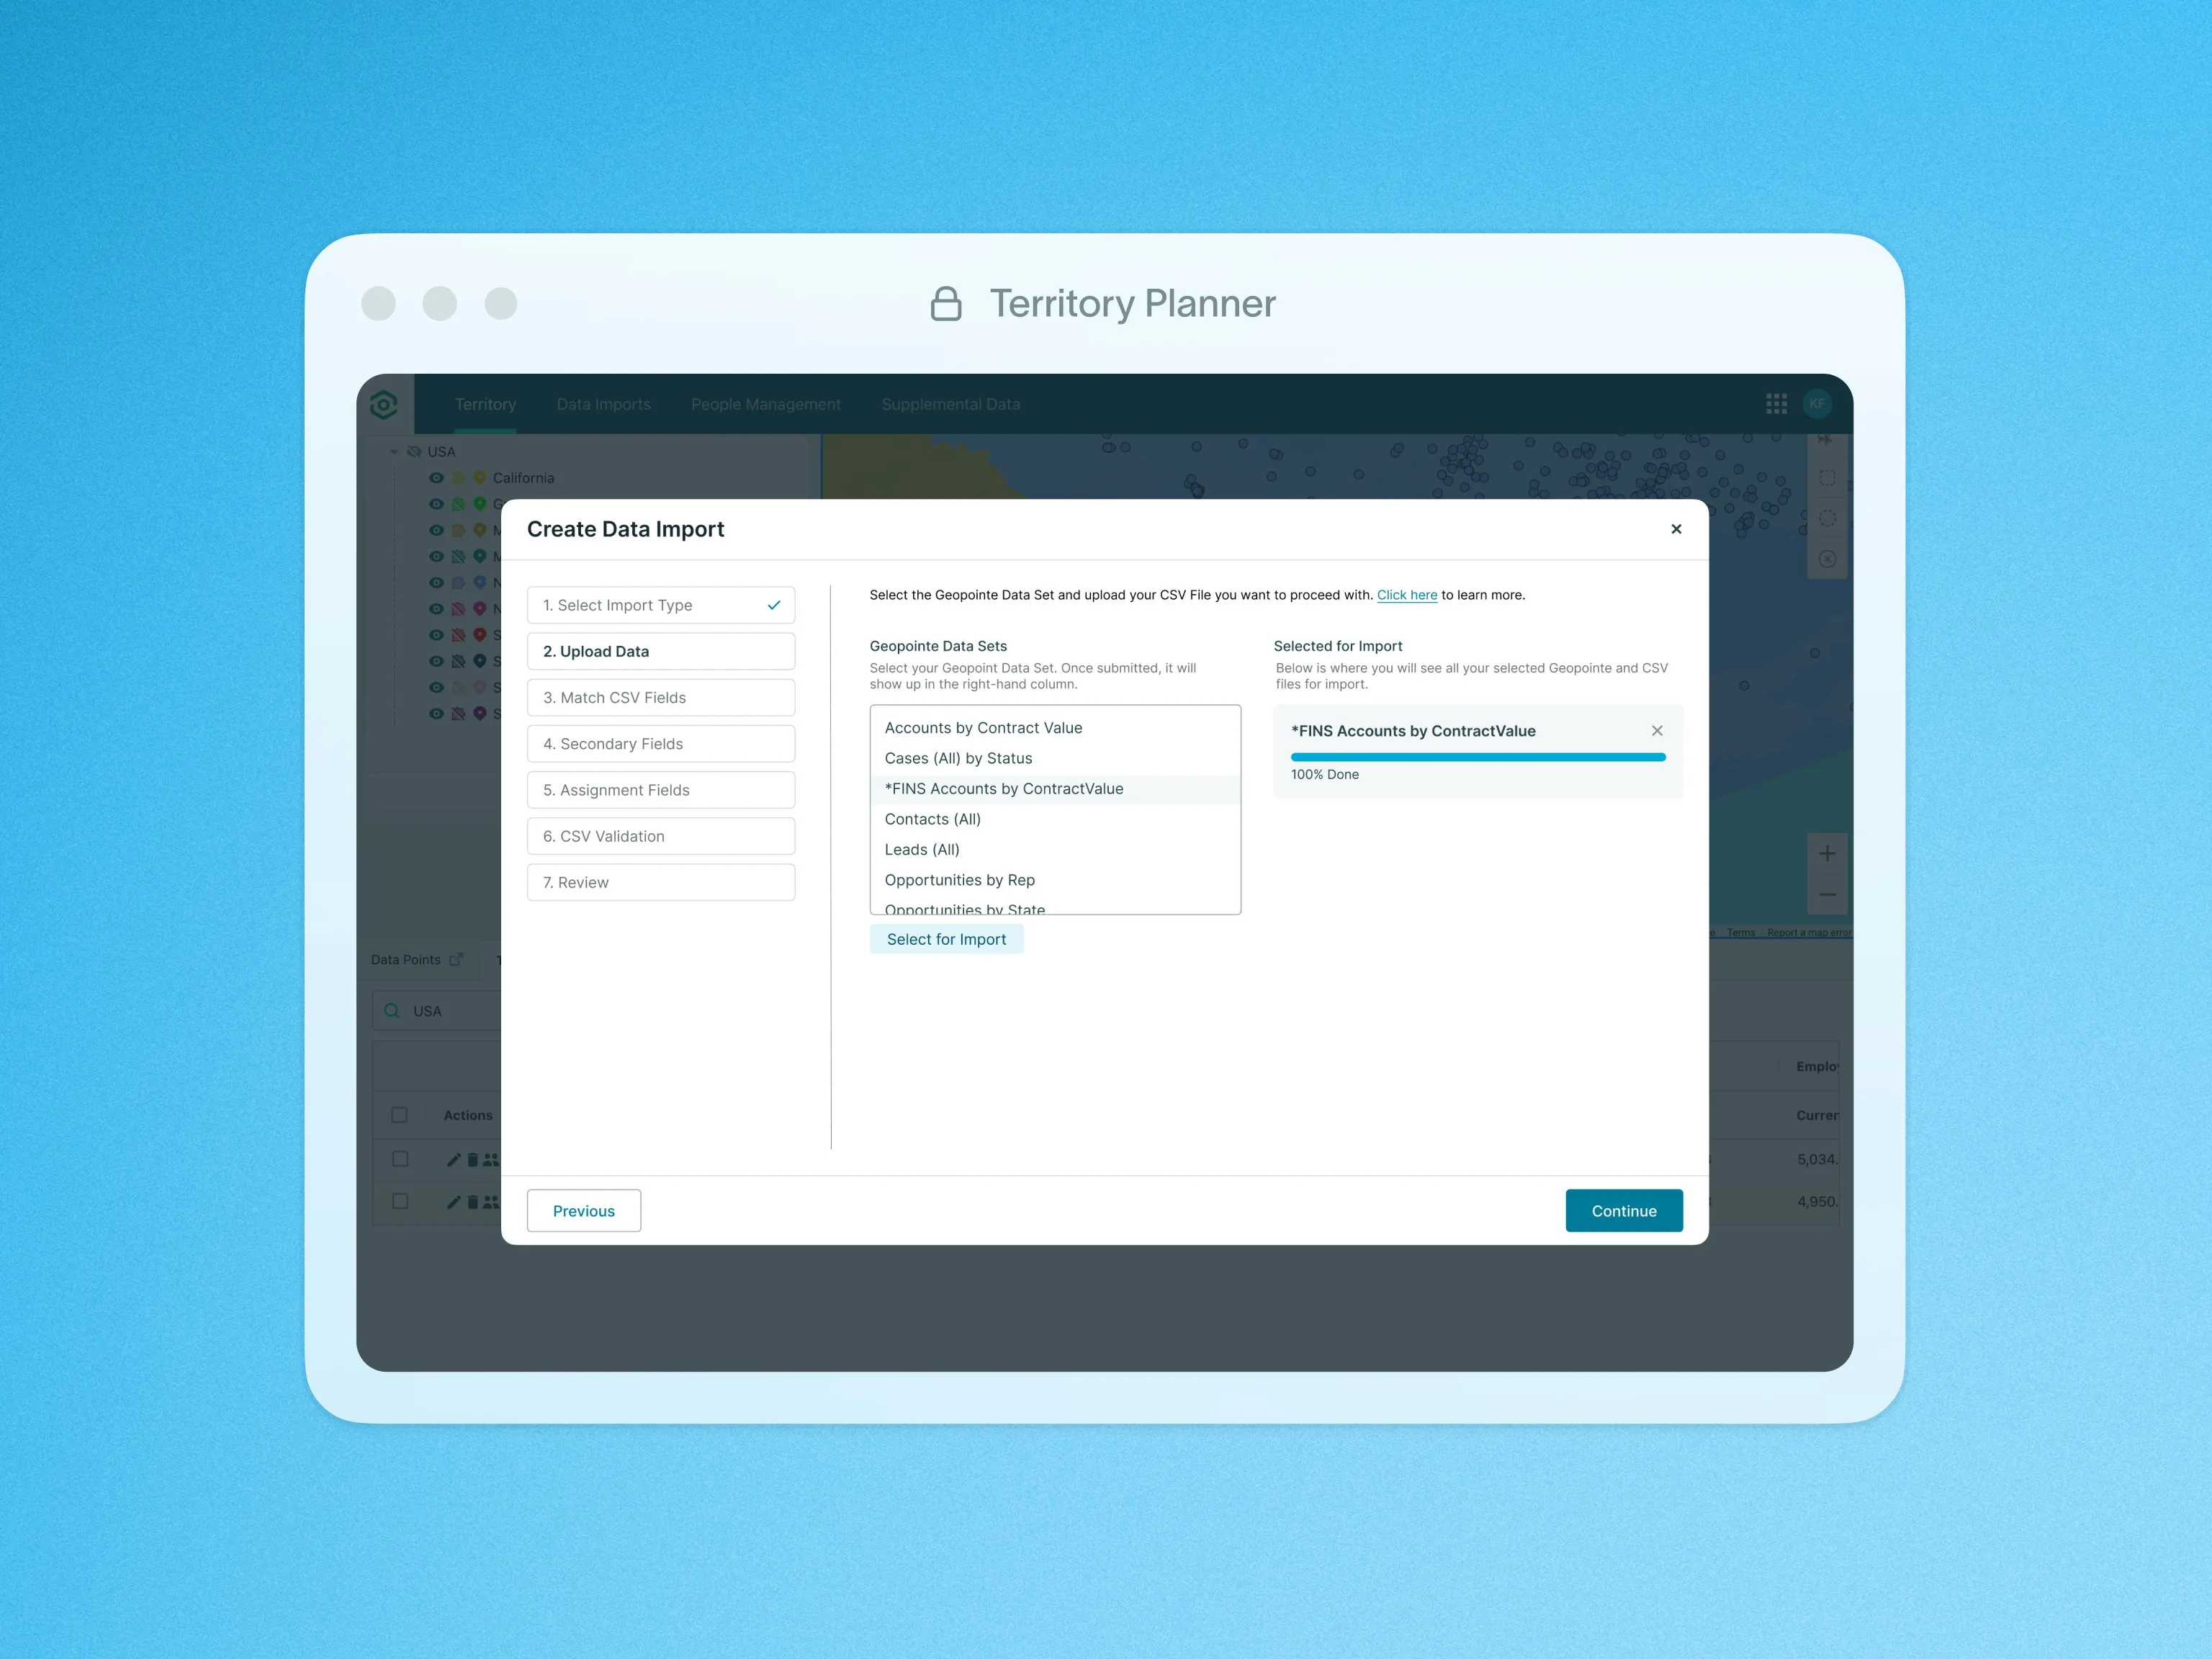
Imported records are displayed as Data Points or Clusters on the map, while imported employees appear as People Markers to provide additional geographic insights. The Info Window lets you see details about each record directly on the map, saving time and making data analysis more efficient.
Visual data, shown as clusters or individual markers, offers clear insights into account distributions. Using these geographic and visual tools, you can gain instant insight from a complete picture of your territories and their value which streamlines the decision-making process.
Admins can select shapes or markers on the map to assign territories quickly and easily. You can also change Data Point colors to reflect your territories, telling a visual story of assignments with clarity. You can zoom in and out to see Data Points and clusters at different levels, ensuring you spend less time navigating and more time on strategic planning.
To learn more about Data Visualization on the Map, visit our help site.